
 English
 日本語
 한국어
 Dansk
 Nederlands
 Italiano
 Español
 Árabe
 Português
 Türkçe
 Deutsch
 Русский
 Français
 Prancis
 ไทย
 Tiếng Việt
 हिंदी
 বাংলা

Fermenter Off-Gas Alerts Earlier Than pH: How to Interpret OUR and CER
It is a common scenario in fermentation production sites: the fermenter DO remains stable at 30%, with no pH alarm triggered. Operators may judge the fermentation status as normal. Half an hour later, CO₂ concentration in the off-gas rises first, accompanied by changes in OUR. Only after the feed pump increases the feeding rate does DO drop significantly.
If operators wait for DO and pH alarms before intervention, the optimal adjustment window is often missed. Off-gas monitoring is not intended to replace DO and pH measurements. Instead, it delivers advanced metabolic signals, directly reflecting oxygen consumption, carbon dioxide release, and the switching point of microbial metabolic pathways. This article does not focus on the instrumentation principles of off-gas analysis. Centered on workshop practical operations, it covers three core topics: basic definitions of OUR and CER, interpretation methods for microbial status, and priority on-site operational points.
1. Why Off-Gas Monitoring Provides Earlier Warnings than pH and DO
DO value reflects the dynamic balance between system oxygen supply and microbial oxygen consumption. Airflow rate, agitation speed, and tank pressure adjustments directly affect DO readings; changes in feeding strategy also alter microbial oxygen consumption rate. DO is a resultant indicator and cannot fully represent the true physiological state of microorganisms.
The same applies to pH. pH drift is usually a lagging outcome of metabolite accumulation, acid-base regulation, or nitrogen source metabolism. By the time pH deviates markedly, abnormal microbial metabolism may have persisted for a period.
Oxygen and carbon dioxide fractions in off-gas are directly linked to microbial respiration and metabolism. When microorganisms enter the exponential growth phase, oxygen consumption and gas production indicators change first. When substrates are nearly depleted, OUR declines earlier than residual sugar test results. Under oxygen-limited conditions, RQ often rises from near 1 to above 1.
Core judgment logic summary: DO indicates oxygen supply margin; OUR characterizes microbial oxygen uptake rate; CER characterizes carbon dioxide evolution rate; RQ determines metabolic direction. These parameters cross-validate rather than substitute for one another.
2. Calculation Principles of OUR and CER
OUR (Oxygen Uptake Rate): the amount of oxygen consumed by microorganisms per unit time and per unit volume of fermentation broth. Common units: mmol O₂/(L·h) or g O₂/(L·h).
CER (Carbon Dioxide Evolution Rate): the amount of carbon dioxide produced by microorganisms per unit time and per unit volume of fermentation broth. Common unit: mmol CO₂/(L·h).
For qualitative trend analysis on site, simplified formulas can be adopted:
OUR ≈ Airflow × (Inlet O₂ concentration − Off-gas O₂ concentration) × Correction factor CER ≈ Airflow × (Off-gas CO₂ concentration − Inlet CO₂ concentration) × Correction factor Respiratory Quotient RQ = CER ÷ OUR
Precise calculation has higher requirements. Molar flow rates of inlet gas and off-gas differ. Inert gas-based material balance is required, and gas flow rates shall be converted under identical temperature and pressure conditions. Volume percentages measured by off-gas analyzers cannot be directly equated to gas flow rates.
Define: V = Volume of fermentation broth F_in = Molar flow rate of inlet gas F_out = Molar flow rate of off-gas x_in = Mole fraction of oxygen in inlet gas x_out = Mole fraction of oxygen in off-gas
Material balance formula for OUR:
OUR = (Fin × xin − Fout × xout) ÷ V
Formula for carbon dioxide evolution rate:
CER = (Fout × yout − Fin × yin) ÷ V
Complex manual recalculation is unnecessary for on-site practice. Continuously collect inlet/off-gas O₂ and CO₂, airflow rate, tank pressure, temperature and fermentation broth volume to ensure comparability of data trends. Mastering the formulas helps understand factors affecting results, instead of mechanical computation.
3. Stabilize Four Preconditions First: Prioritize Trend Analysis over Absolute Values
The main challenge of OUR and CER analysis lies not in calculation precision, but in consistent detection conditions across measurements.
1. Stable gas flow rate: Variations in airflow directly change off-gas component proportions. OUR data interpretation must reference airflow simultaneously. Judging oxygen consumption rise merely by off-gas O₂ percentage may easily misclassify airflow fluctuation as microbial metabolic change.
2. Regular analyzer calibration: Analyzer range, zero calibration, standard gas, response time, and condensed water in sampling pipelines all interfere with detection. Overlong sampling lines or un-drained condensate lead to lagging or underrated CO₂ readings.
3. Synchronously record temperature and tank pressure: Gas volume varies with temperature and pressure. Volumetric flow of off-gas cannot be directly compared with molar flow. Batch reports shall retain tank pressure, off-gas temperature and flow data to maintain unified benchmark for comparison.
4. Analyze trends first, then reference single-point values: Absolute OUR values vary greatly among fermenters, culture media and strains. The trend of parameters deviating from baseline within one batch carries more reference value than instantaneous single-point readings. Before cross-batch comparison, establish baseline data from 2–3 consecutive stable qualified batches.
4. Four Typical Off-Gas Parameter Combinations and Microbial Status Interpretation
1. OUR ↑, CER ↑, RQ close to 1 Microorganisms show vigorous metabolic activity with sufficient substrate supply and accelerated growth. Analyze together with DO and feeding parameters: stable DO and adequate residual sugar indicate normal aerobic growth. Continuous OUR increase paired with gradual DO decrease means shrinking oxygen supply margin of the system.
2. OUR ↓, CER ↓, RQ remains stable Overall metabolic activity of microorganisms weakens. Common triggers: near substrate depletion, insufficient feeding, low culture temperature, seed culture not entering exponential phase, or microbial decay. Troubleshooting shall not rely solely on DO; prioritize checking feeding status, residual sugar, seed quality and incubation temperature.
3. OUR ↓, CER ↑, RQ significantly >1 Microbial oxygen consumption decreases while CO₂ generation continues. This commonly occurs under oxygen shortage or local hypoxia, where metabolism shifts to fermentative byproducts and cells enter inefficient metabolic pathways. In high-density E. coli fermentation, this profile is often accompanied by excessive feeding rate and acetic acid accumulation. On-site operations first verify whether DO hits the lower limit and whether agitation/aeration reaches equipment maximum, then check feeding rate.
4. OUR ↑, CER unchanged or even decreased, RQ below baseline Microbial oxygen consumption rises without synchronous CO₂ release, indicating metabolic pathway shift. Causes include substrate switching, feed composition adjustment, product formation phase, or carbon source type change. Relying solely on RQ easily leads to misjudgment. Comprehensive evaluation combining feed composition, pH, residual sugar and product assay is mandatory.
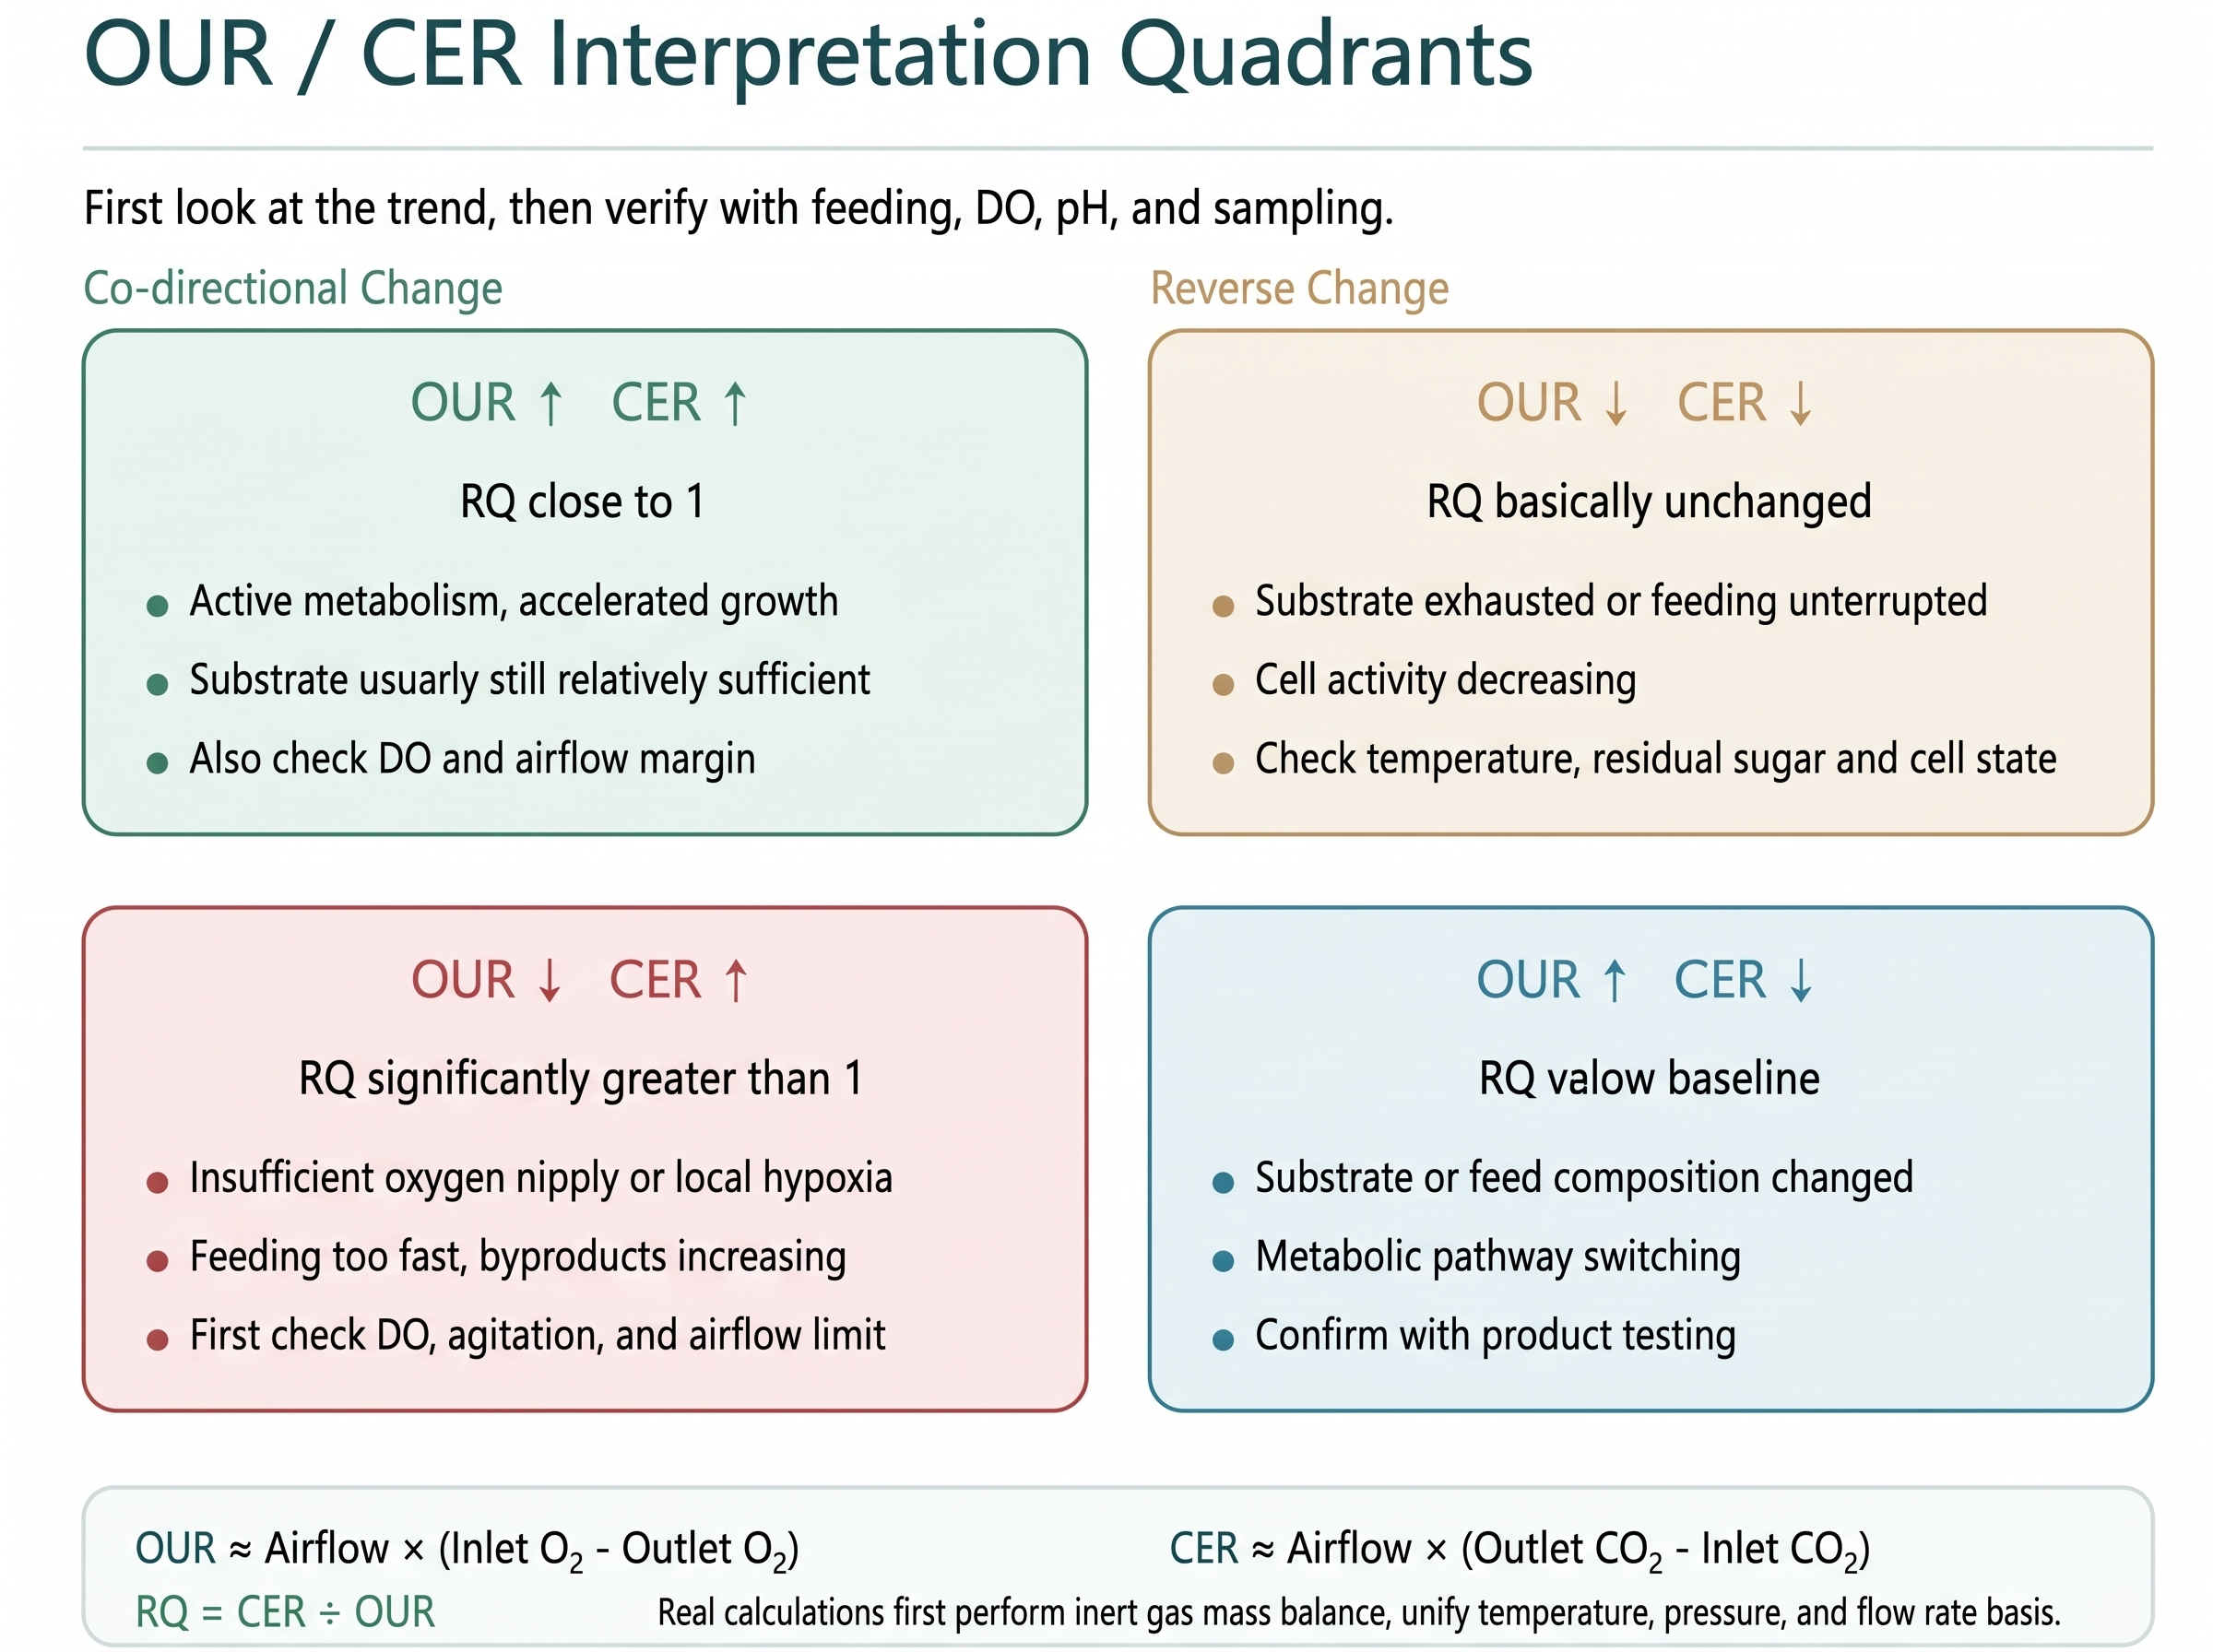
▲ Figure 1 OUR, CER and RQ shall be analyzed jointly; locate time points where parameters deviate from baseline, then cross-validate via feeding, DO, pH and sampling tests.
5. Comprehensive Evaluation Combining Off-Gas, DO, pH and Feeding
The core value of off-gas monitoring is not to independently confirm microbial abnormality, but to locate fault categories.
· Stable DO with sudden OUR drop: No obvious fluctuation in oxygen supply system; microbial oxygen consumption capacity declines. Prioritize checking substrate depletion, feed interruption and temperature anomaly, then test cell activity and contamination risk.
· DO drop with OUR rise: Microbial oxygen consumption increases while oxygen supply capacity is insufficient. Check feed acceleration and rapid microbial proliferation; meanwhile inspect stability of aeration, agitation, tank pressure and air system.
· DO rebound with OUR drop: Mostly caused by substrate depletion or reduced cell activity. Increased DO does not necessarily mean improved aeration; it may result from weakened microbial oxygen consumption.
· pH drift paired with RQ change: Metabolite composition alters. pH is only a result; RQ helps judge acid production, acid consumption or carbon/nitrogen metabolism switching.
· No OUR response after feed adjustment: Verify actual delivery flow of feed pump, whether substrate enters the tank normally, sampling representativeness and microbial metabolic responsiveness. Do not only read pump display values.
Plot all parameters on the same timeline to capture metabolic change points earlier than checking DO and pH at single time points.
6. Practical Case of High-Density Fermentation
A common scenario in high-density fermentation: cascade control maintains stable DO and no obvious abnormality appears on the operation screen. However, off-gas RQ gradually rises from near 1, followed by OUR decline.
Review of feeding records usually reveals excessively increased feed flow rate, local substrate overload or insufficient oxygen supply margin. Microbes still consume carbon sources, yet partial metabolism diverts to byproducts. Sole DO reading may mislead operators to believe oxygen supply is sufficient; sole residual sugar test may suggest adequate carbon source without feed reduction.
Comprehensive analysis of OUR, CER and RQ clarifies the control strategy: reduce feed rate or adopt gentler fed-batch mode, confirm remaining agitation and aeration capacity, then re-test whether RQ returns to baseline. Waiting for pH and product assay results before adjustment leads to massive accumulation of byproducts.
Not all RQ elevation requires immediate feed reduction. Exclude interferences from analyzers, airflow and tank pressure first, then combine cell microscopy, residual sugar, DO and product detection for integrated judgment. Off-gas trend serves as an early warning signal and cannot be used alone as the basis for process adjustment.
7. Application for Non-Growth Coupled Reactions such as Steroid Transformation
Steroid transformation does not rely on massive microbial proliferation to synthesize target products. OUR and CER values cannot be directly equated to product conversion rate, yet they reflect cell activity, oxygen supply status and redox metabolic balance.
Take steroid C1,2-dehydrogenation and hydroxylation transformation as examples. The reactions depend on cellular metabolism and redox balance. After substrate addition, oxygen consumption rises, pH shifts and product generation occurs, with chronological correlation among these indicators. Persistently low OUR after substrate dosing without metabolic response: prioritize checking cell activity, oxygen supply and whether substrate effectively participates in the reaction. High OUR paired with flat conversion rate: substrate may undergo bypass metabolism, or local conditions disfavor target transformation reactions.
For engineered strain processes, plasmid stability, induction conditions and byproduct formation shall also be considered. Off-gas trend cannot replace product conversion testing, yet it accurately pinpoints the starting time of cellular metabolic abnormality.
8. Three Feasible Basic Tasks for Workshops without On-Line Off-Gas Analyzers
Workshops not equipped with complete on-line off-gas monitoring systems can still implement basic data analysis:
1. Fully record off-gas O₂, CO₂, airflow rate, tank pressure and temperature data. Ensure unified timeline for data within one batch instead of collecting isolated instantaneous readings.
2. Establish baseline for stable batches. Continuously record 2–3 qualified batches to define normal ranges and variation patterns of OUR, CER and RQ for your process. Judge by parameter deviation from baseline instead of directly applying general literature values.
3. Correlate off-gas changes with on-site operations. Mark feeding, alkali addition, agitation speed increase, aeration adjustment, tank pressure change, sampling and harvest on the timeline. Whenever off-gas parameters fluctuate, first check the tank operations performed just before.
When conditions permit, proceed with gas analyzer calibration, sampling pipeline condensate drainage, flow meter verification and off-gas condenser inspection. The biggest limitation of off-gas analysis is often not lack of instruments, but inconsistent benchmark of measured data.
9. Off-Gas Monitoring Provides Advance Warning, Not Substitute Detection
The key advantage of OUR, CER and RQ is capturing microbial metabolic anomalies earlier than DO, pH and off-line sampling.
Nevertheless, off-gas data cannot serve as the sole basis for process decisions. It requires comprehensive evaluation combined with control parameters, feeding logs, residual sugar, cell microscopy and product detection. Trends first prompt abnormal signals, while sampling tests identify root causes.
Summary of core on-site operational principles:
1. Confirm stable airflow and gas analyzer performance;
2. Plot continuous trend curves of OUR, CER and RQ;
3. Cross-compare with DO, pH, feeding and temperature parameters;
4. Locate root causes via residual sugar, microscopy and product testing.
Off-gas monitoring is no obscure theory. It is a set of metabolic monitoring clues that alert ahead of pH alarms and require verification.
